Achieving healthy indoor air quality is not merely a coincidence. In spaces with numerous occupants or poor ventilation, oxygen levels can decrease while carbon dioxide and other pollutants increase, affecting individuals' alertness, productivity, and comfort. A recent Steelcase study in 2023 highlighted that teams experienced up to a 17% rise in perceived productivity in environments designed for optimal air quality and ventilation, emphasizing the significant connection between indoor environmental quality and overall performance. The WELL v2 standard further suggests maintaining carbon dioxide (CO₂) levels below 800–1000 ppm in frequently used areas to enhance cognitive function and wellbeing.
While oxygen meters provide O₂ percentages (typically around 20.9% at sea level), CO₂ sensors often serve as a more practical measure of ventilation effectiveness. Gensler’s research indicates that improved ventilation and lower CO₂ levels are associated with better decision-making and decreased fatigue, particularly in environments like meeting rooms and classrooms. For more comprehensive strategies related to overall building health, the WELL Building Standard sets benchmarks for particulate matter, VOCs, humidity, and thermal comfort, including CO₂ levels. Discover more through WELL v2 and Steelcase’s findings for actionable benchmarks.
Distinguishing Between Oxygen and CO₂ in Indoor Spaces
In most indoor settings, oxygen levels stay close to normal atmospheric ranges unless combustion issues arise or there are high occupancy situations lacking proper ventilation. However, CO₂ levels can rapidly increase in cramped environments due to human exhalation; a CO₂ concentration above 1000–1200 ppm typically signals dull air, leading to limited oxygen availability and potential cognitive impairments. I consider CO₂ monitoring an essential everyday tool, saving O₂ meters for specific cases like laboratories, medical environments, or areas with gas appliances that require close supervision.
Essential Metrics for Air Quality Assessment
In order to manage indoor air quality (IAQ) effectively, I recommend monitoring:
Choosing Effective Smart Sensors
Not all sensors offer the same reliability. Look for non-dispersive infrared (NDIR) sensors for CO₂ that include auto-calibration and data logging capabilities. For O₂ monitoring, opt for electrochemical or paramagnetic sensors that adhere to proper calibration protocols. Devices should provide:
Strategizing Sensor Placement and Room Layout
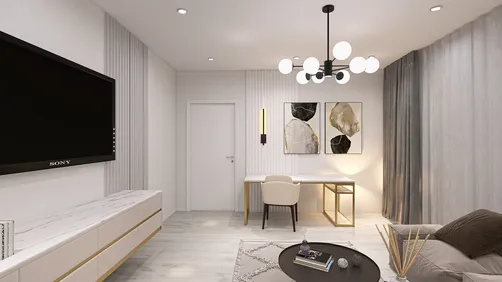
It’s essential to position sensors at breathing height (around 1.1–1.5 m), ensuring they’re not too close to direct air supply diffusers, windows, or doors that may disrupt airflow patterns. In larger areas, distribute sensors to eliminate blind spots; ideally, one sensor per 500–1000 square feet, depending on how crowded a space is. I also plan sensor placements in conjunction with furniture arrangements and airflow paths—meeting tables, circulation routes, and areas with frequent usage—by utilizing a room layout tool for visual clarity and placement trials, perhaps employing tools like Homestyler.
Utilizing Room Layout Tools
Considering Human Factors: Comfort, Cognition, and Behavior
Individuals often unconsciously modify their behaviors based on air quality; they might open windows, move to different seats, or take breaks from conversations. CO₂ levels above 1200 ppm are frequently associated with headaches and diminished alertness; low humidity (below 30%) can lead to dryness, while levels exceeding 60% create a feeling of heaviness and can foster mold growth. By integrating sensors with visible dashboards or traffic-light systems, occupants gain control over their environment—reducing complaints and elevating perceived comfort, a factor known to positively influence workplace satisfaction as supported by various industry studies.
Considering Lighting and Acoustics as Interlinked Factors
People’s perceptions of air quality can also be affected by lighting and sound. I design lighting solutions that offer appropriate brightness for tasks and warm-neutral light temperatures (3000–4000K) to minimize harshness and glare. Effective acoustic absorption (NRC 0.7+ for ceiling panels or wall surfaces) alleviates stress and complements good air flow, consequently helping individuals feel more at ease. While these factors don’t directly alter oxygen levels, they significantly contribute to occupants' comfort within the same IAQ standards.
Implementing Ventilation Strategies: Demand-Control and Filtration
In high-demand spaces, apply demand-controlled ventilation (DCV) regulated by CO₂ sensors to introduce outside air when necessary. This should be paired with MERV 13 filtration systems to capture smaller particulate pollutants. If it's practical to open windows, synchronize their use with outdoor air quality indexes and indoor humidity targets. Make sure mixed-mode systems’ dampers and economizers are calibrated to respond to real-time sensor input rather than relying on outdated schedules.
Material Selection and VOC Control
Opt for low-VOC paints, finishes, and furnishings. Plan for a period of increased ventilation after installation to flush out any residual airborne materials. Position VOC sensors in areas where new materials tend to gather—such as pantries, printing facilities, or renovated offices—and monitor trends for a duration of 2 to 4 weeks post-installation. Material libraries that validate sustainability credentials can assist in effective procurement planning.
Routine Maintenance and Calibration Practices
Perform quarterly evaluations for sensor calibration: compare their readings against a verified reference point or outdoor conditions. Replace O₂ sensor cells according to the specified lifespan by the manufacturer (generally every 2–3 years). Ensure filters are changed as scheduled and confirm that outside air intakes are clear of obstructions. Data without proper calibration can lead to misleading conclusions; I regard calibration as essential maintenance, akin to regularly updating important equipment.
Visualizing Data and Setting Alerts
Use an intuitive dashboard that displays CO₂, O₂, PM2.5, VOCs, temperature, and humidity metrics to convey a complete picture of air quality. Establish thresholds: green for CO₂ levels below 800 ppm, yellow for 800–1000 ppm, and red for measurements exceeding 1000 ppm. Automate alerts for prolonged deviations. For teams, provide weekly summaries to promote diligent habits—such as keeping doors closed during HVAC operation, ensuring return grills are not obstructed, and monitoring occupancy in smaller rooms.
Safety Measures
In specialized environments—like laboratories, warehouses with combustion units, or facilities storing gases—monitoring O₂ levels is crucial. Alarms should activate at levels below 19.5% O₂, accompanied by clear evacuation signage and training. Place monitors near probable sources and along exit paths. Ensure alignment with facility practices and regulations to guarantee compliance.
Designing for Future Resilience
Consider future-proofing your design by integrating various sensor types, ensuring firmware updates are easy, and using open protocols. Accessible placement for maintenance fosters trust in the system among users, allowing for consistent air quality management.
Tips for a Quick Start Checklist
- Select NDIR CO₂ and calibrated O₂ sensors that integrate and log data effectively.
- Strategically map sensor locations at breathing height, away from direct air supply sources.
- Trigger CO₂ alerts at the 1000 ppm mark and analyze weekly data trends.
- Aim to maintain relative humidity between 40–60% and target PM2.5 levels under 12 μg/m³.
- Utilize low-VOC materials and conduct a flush-out after renovations.
- Commission demand-controlled ventilation systems and confirm MERV 13 filtration wherever feasible.
- Establish a routine for calibration and keep thorough maintenance records.
Frequently Asked Questions
1. Do I need an oxygen meter for standard office conditions?
Typically, CO₂ monitoring suffices. In well-ventilated offices, oxygen levels remain around 20.9%; CO₂ provides a practical measure of ventilation effectiveness and occupancy loads.
2. At what CO₂ level should I take action?
Increase ventilation around 800–1000 ppm, in line with recommendations from WELL v2. Levels exceeding 1000 ppm warrant immediate responses—such as opening windows, decreasing occupancy, or enhancing outside air inflow.
3. Can high CO₂ levels directly impact oxygen availability?
Although CO₂ can displace fresh air and often correlates with lower oxygen availability in poorly ventilated spaces, the total O₂ percentage might not significantly decline, yet occupants may experience drowsiness due to elevated CO₂ levels.
4. Where is the best location for sensors?
Position them at breathing height (1.1–1.5 m), away from air supply sources and direct sunlight, and close to areas with consistent occupancy such as conference tables. Larger rooms may require multiple sensors to eliminate blind spots.
5. How frequently should sensors undergo calibration?
Sensor checks should occur quarterly, adhering to manufacturer instructions—CO₂ sensors might need annual verification; O₂ sensor cells often require replacement every 2–3 years.
6. What humidity range is optimal?
Aim to sustain relative humidity between 40–60% for comfort and health. Levels below 30% can lead to dryness, while those above 60% could encourage mold growth and discomfort.
7. Are consumer-grade IAQ monitors reliable?
Many provide useful information regarding trends, especially NDIR CO₂ models. Evaluate their accuracy, calibration options, and whether they offer data logging features. For critical applications, opt for professional-grade devices.
8. Can improvements to IAQ enhance productivity?
Absolutely. Research from organizations like Steelcase has clarified the connection between enhanced air quality and ventilation with improved focus and perceived productivity
9. What VOC management strategies should I use after renovations?
Select low-VOC materials, ensure aggressive ventilation, and monitor VOC levels for 2–4 weeks. Implementing a flush-out can assist in removing residual emissions from paints and adhesives.
10. How can I best visualize data for occupants?
Employ a straightforward dashboard with clear traffic-light indicators and weekly summaries. Visibility fosters trust and encourages behaviors that help maintain ideal air quality settings.


Homestyler is an exceptional online home design platform that caters to your creative needs. Its user-friendly design tool allows you to create stunning spaces, while the impressive 3D renderings and DIY video tutorials provide inspiration and guidance. Transform your home design ideas into reality effortlessly!
Projete agora para LIVRE